Carbon Dioxide and Growth Rate in Algae
AlgaeCO2.RdGrowth rates of the unicellular alga Chlamydomonas after 1,000
generations of selection under High and Normal levels of
carbon dioxide.
Format
A data frame with 14 observations on the following 2 variables.
- treatment
a factor with levels
NormalandHigh- growthrate
a numeric vector
Source
Collins, S. and G. Bell. 2004. Phenotypic consequences of 1,000 generations of selection at elevated CO\(_{2}\) in a green alga. Nature 431: 566-569.
Examples
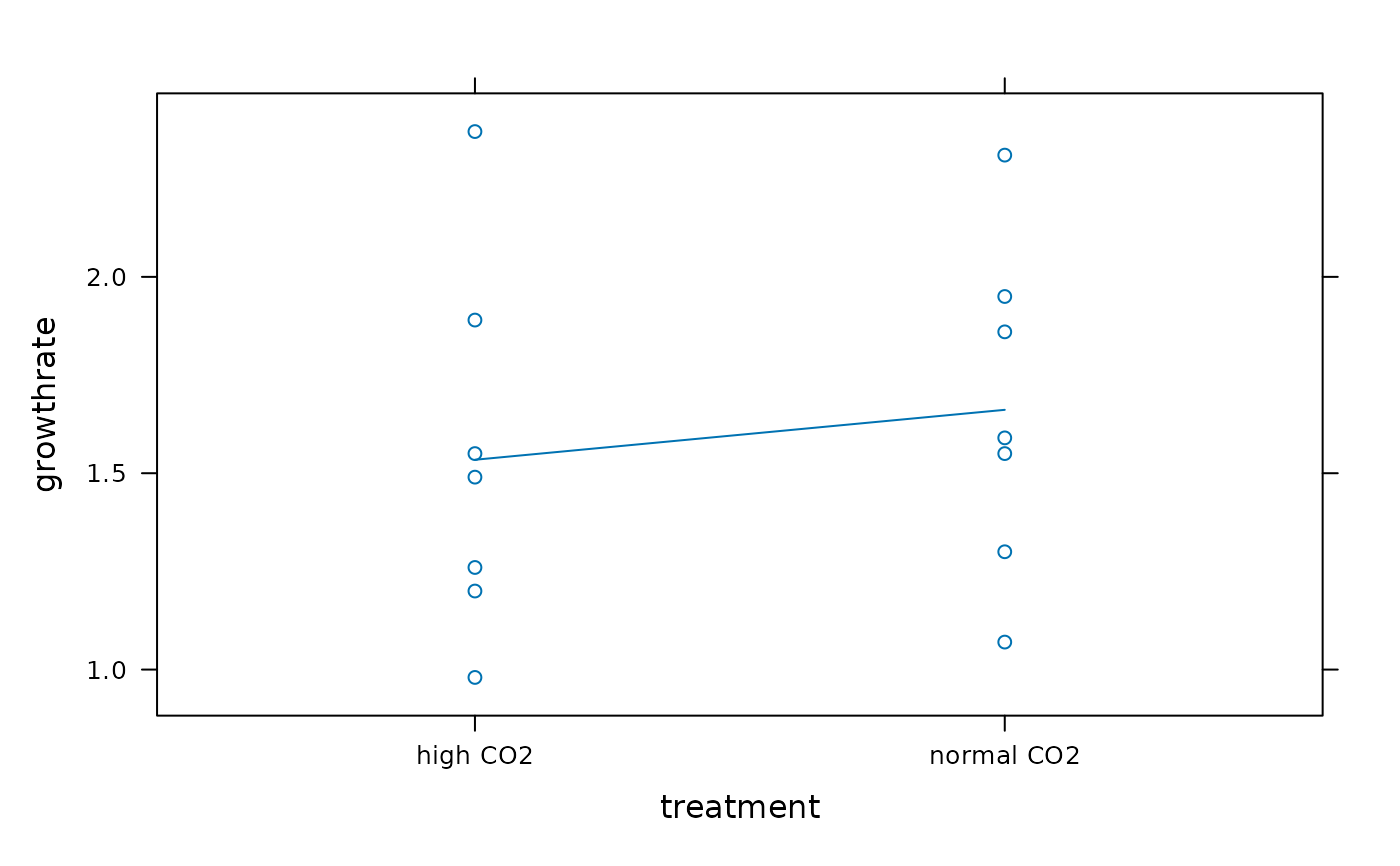
AlgaeCO2
#>     treatment growthrate
#> 1  normal CO2       2.31
#> 2  normal CO2       1.95
#> 3  normal CO2       1.86
#> 4  normal CO2       1.59
#> 5  normal CO2       1.55
#> 6  normal CO2       1.30
#> 7  normal CO2       1.07
#> 8    high CO2       2.37
#> 9    high CO2       1.89
#> 10   high CO2       1.55
#> 11   high CO2       1.49
#> 12   high CO2       1.26
#> 13   high CO2       1.20
#> 14   high CO2       0.98
xyplot(growthrate ~ treatment, AlgaeCO2, type = c('p', 'a'))
