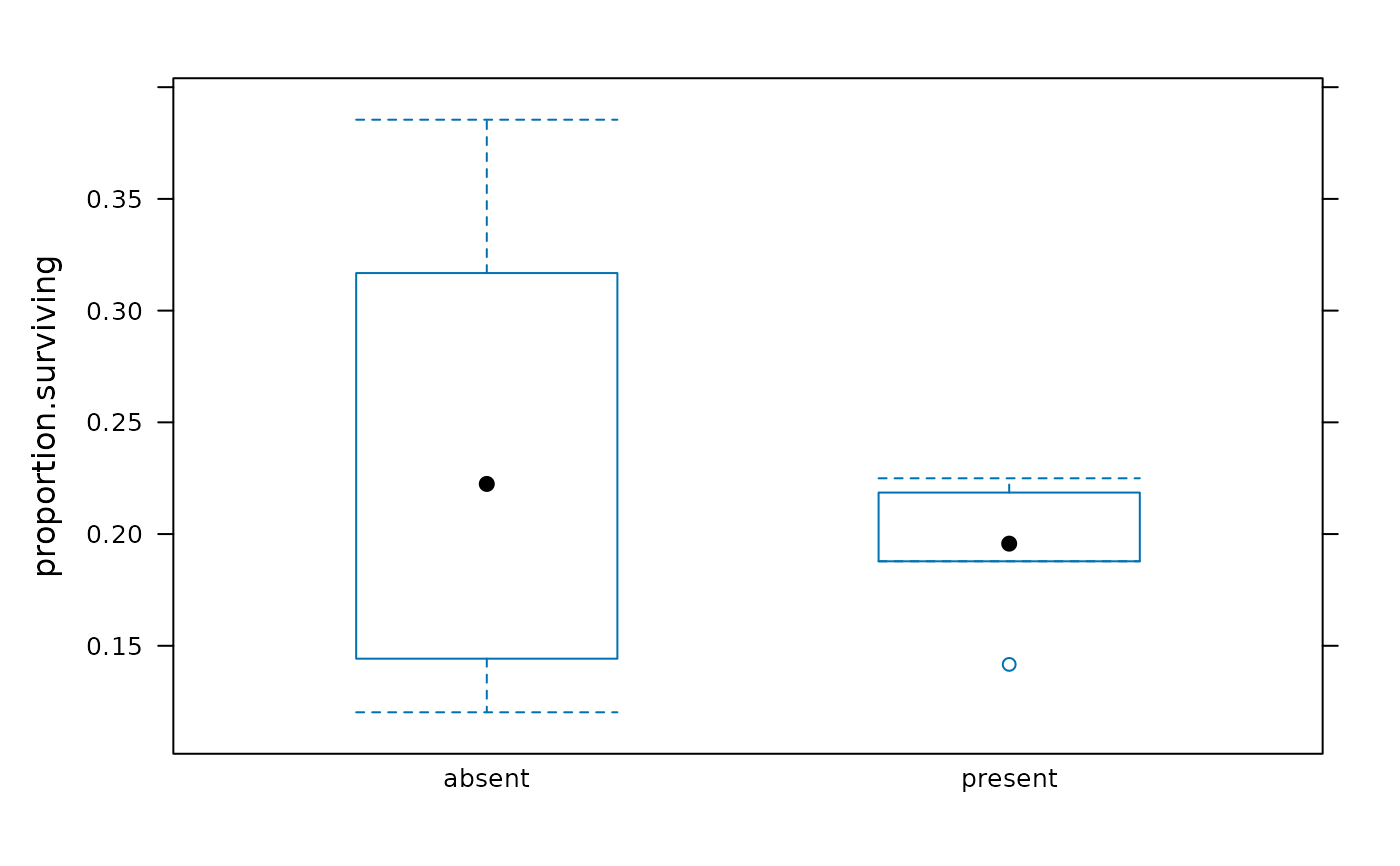
Salmon Survival in the Presence of Brook Trout
BrookTrout.RdTotal numbers of salmon released (salmon.released) and surviving
(salmon.surviving) in 12 streams, 6 with brook trout present
and 6 with brook trout absent. The proportion of salmon surviving
(proportion.surviving) is given for each stream.
Format
BrookTrout is a data frame with 12 observations on the
following 4 variables. BrookTrout2 is a different summary of the
same study and gives survival rates for chinook in different years.
- trout
a factor with levels
absentandpresentindicating whether brook trout are absent or present in the stream- salmon.released
a numeric vector of the total number of salmon released
- salmon.surviving
a numeric vector of the number of salmon surviving
- proportion.surviving
a numeric vector of the proportion of salmon surviving
Source
Levin, P.S., S. Achord, B.E. Fiest, and R.W. Zabel. 2002. Non-indigenous brook trout and the demise of Pacific salmon: a forgotten threat? Proceedings of the Royal Society of London, Series B, Biological Sciences 269: 1663-1670.
Examples
str(BrookTrout)
#> 'data.frame':	12 obs. of  4 variables:
#>  $ trout               : Factor w/ 2 levels "absent","present": 2 1 2 2 1 2 1 2 1 1 ...
#>  $ salmon.survived     : int  166 180 136 153 178 103 326 173 7 120 ...
#>  $ salmon.released     : int  820 467 960 700 959 545 1029 769 27 998 ...
#>  $ proportion.surviving: num  0.202 0.385 0.142 0.219 0.186 ...
str(BrookTrout2)
#> 'data.frame':	12 obs. of  9 variables:
#>  $ trout                : Factor w/ 2 levels "absent","present": 2 1 2 2 1 2 1 2 1 1 ...
#>  $ chinook.survival.1998: num  0.202 0.385 0.142 0.219 0.186 0.189 0.317 0.225 0.259 0.12 ...
#>  $ chinook.survival.1993: num  0.215 0.294 0.12 0.158 0.168 0.105 0.259 0.183 0.2 0.134 ...
#>  $ chinook.survival.1999: num  0.197 0.353 0.188 0.212 0.201 0.151 0.237 0.147 NA 0.13 ...
#>  $ mean.chinook.survival: num  0.194 0.339 0.134 0.176 0.176 ...
#>  $ chinook.survival.1992: num  0.16 0.325 0.086 0.116 0.15 0.228 0.347 0.133 0.48 0.152 ...
#>  $ arcsin               : num  0.466 0.669 0.386 0.487 0.446 ...
#>  $ survivors            : int  166 180 136 153 178 103 326 173 7 120 ...
#>  $ num.released         : int  820 467 960 700 959 545 1029 769 27 998 ...

bwplot(proportion.surviving ~ trout, BrookTrout)


aggregate(proportion.surviving ~ trout, BrookTrout, FUN = favstats)
#> Warning: corrupt data frame: columns will be truncated or padded with NAs
#>     trout proportion.surviving
#> 1  absent            0.1202405
#> 2 present            0.1416667
summary(proportion.surviving ~ trout, BrookTrout, fun = favstats)
#>  Length   Class    Mode
#>       3 formula    call