Daphnia Resistance to Cyanobacteria
DaphniaResistance.RdResistance of Daphnia eggs to different levels of cyanobacteria
(cyandensity) from 1962-1997.
Format
A data frame with 32 observations on the following 2 variables.
- density
a factor with levels:
high,low, andmed- resistance
a numeric vector
Source
inferred from Hairston, N.G., Jr., W. Lampert, C.E. Cáceres, C.L. Holtmeier, L.J. Weider, U. Gaedke, J.M. Fischer, J.A. Fox, and D.M. Post. 1999. Dormant eggs record rapid evolution. Nature 401: 446.
Examples
str(DaphniaResistance)
#> 'data.frame':	32 obs. of  2 variables:
#>  $ density   : Factor w/ 3 levels "high","low","med": 1 1 1 1 1 1 1 1 1 1 ...
#>  $ resistance: num  0.65 0.73 0.74 0.76 0.81 0.82 0.85 0.86 0.88 0.9 ...


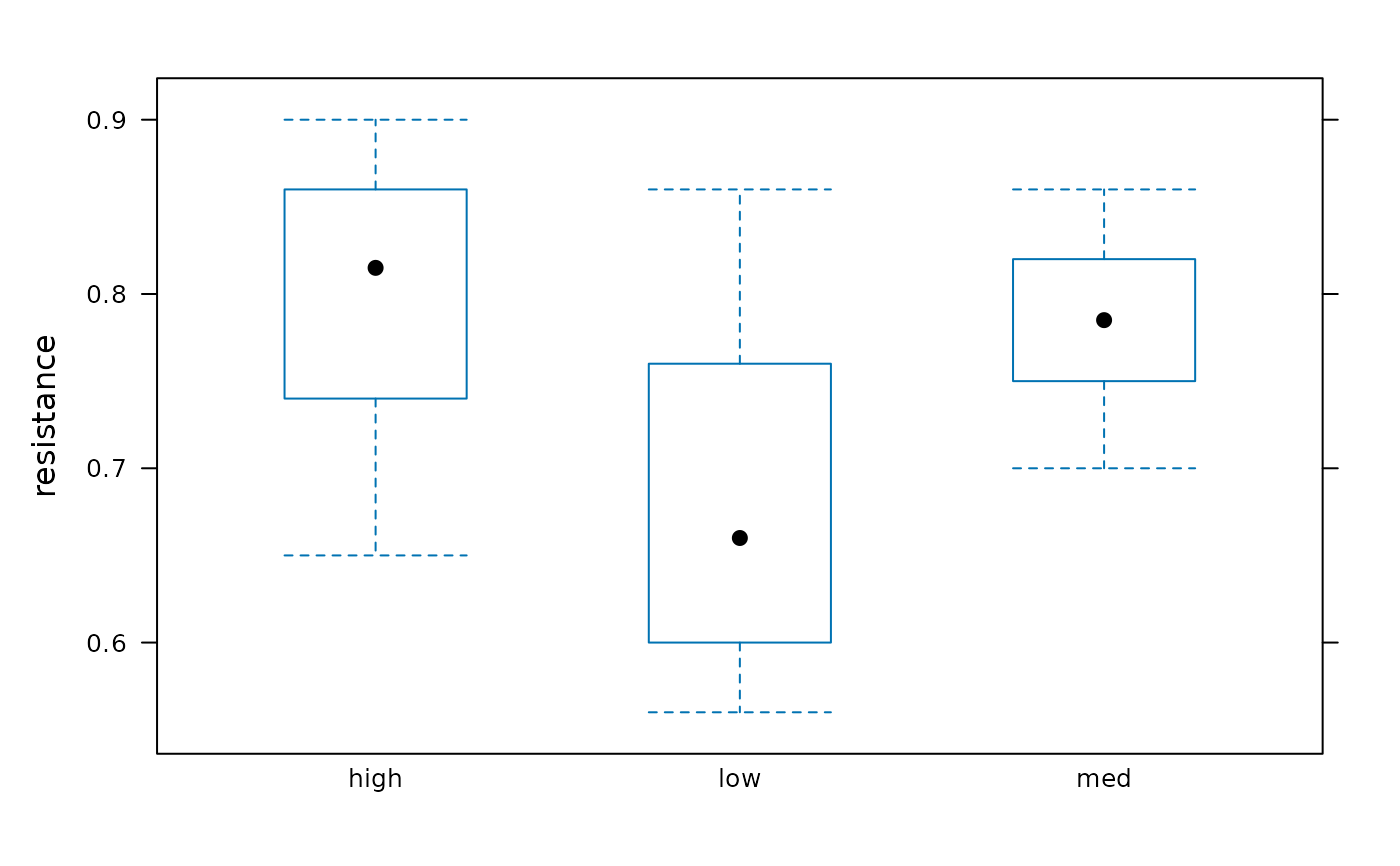
bwplot(resistance ~ density, DaphniaResistance)

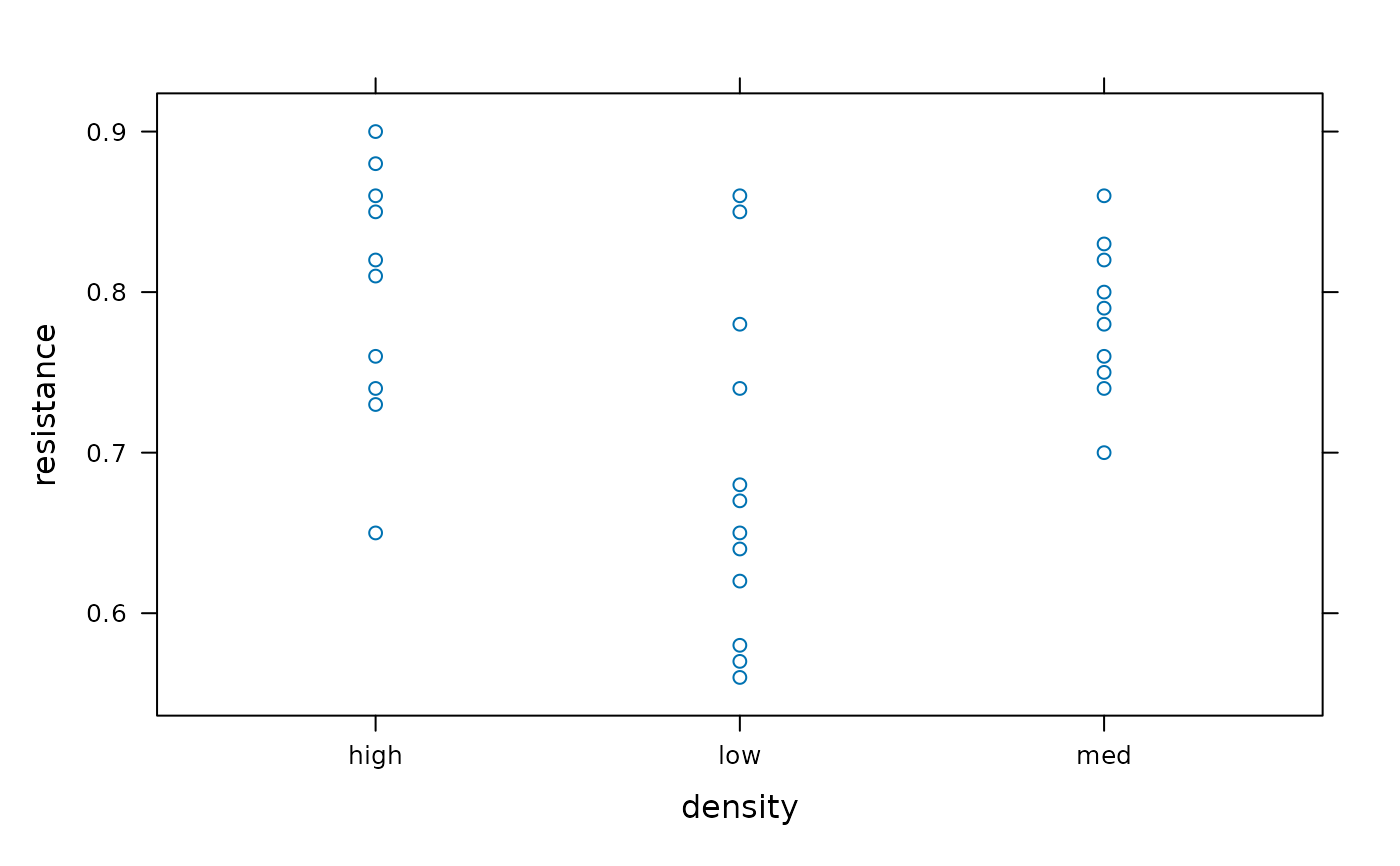
# with such a small data set, we can display all the data
# rather than a summary
xyplot(resistance ~ density, DaphniaResistance)

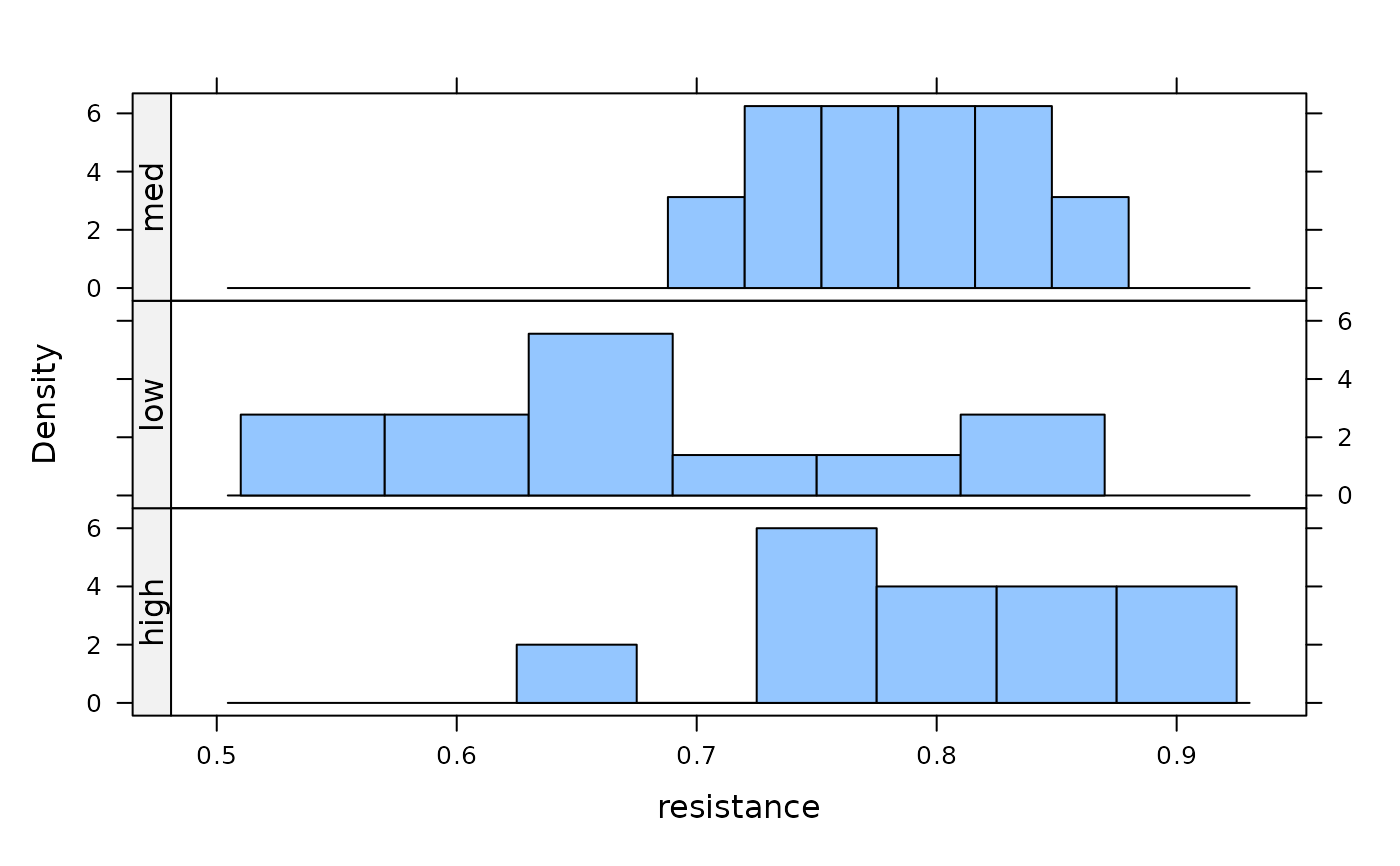
histogram(~ resistance| density, DaphniaResistance,
           strip=FALSE, strip.left = TRUE,
           layout=c(1,3)
           )
