Eelgrass Genotypes
Eelgrass.RdNumber of shoots (shoots) surviving in each of 32 experimental plots
planted with 1, 3, or 6 different genotypes of eelgrass
(treatment.genotypes).
Format
A data frame with 32 observations on the following 2 variables.
- genotypes
a numeric vector of the number of genotypes planted in each plot
- shoots
a numeric vector of the total number of shoots in each plot
Source
inferred from Reusch, T.B.H., A. Ehlers, A. Hämmerli, and B. Worm. 2005. Ecosystem recovery after climatic extremes enhanced by genotypic diversity. Proceedings of the National Academy of Sciences (USA) 102: 2826-2831.
Examples
Eelgrass
#>    genotypes shoots
#> 1          1     71
#> 2          1     61
#> 3          1     49
#> 4          1     38
#> 5          1     36
#> 6          1     32
#> 7          1     30
#> 8          1     28
#> 9          1     27
#> 10         1     21
#> 11         1     14
#> 12         1     11
#> 13         3     67
#> 14         3     58
#> 15         3     53
#> 16         3     52
#> 17         3     47
#> 18         3     46
#> 19         3     41
#> 20         3     36
#> 21         3     35
#> 22         3     20
#> 23         6     86
#> 24         6     84
#> 25         6     69
#> 26         6     64
#> 27         6     62
#> 28         6     48
#> 29         6     45
#> 30         6     31
#> 31         6     47
#> 32         6     45

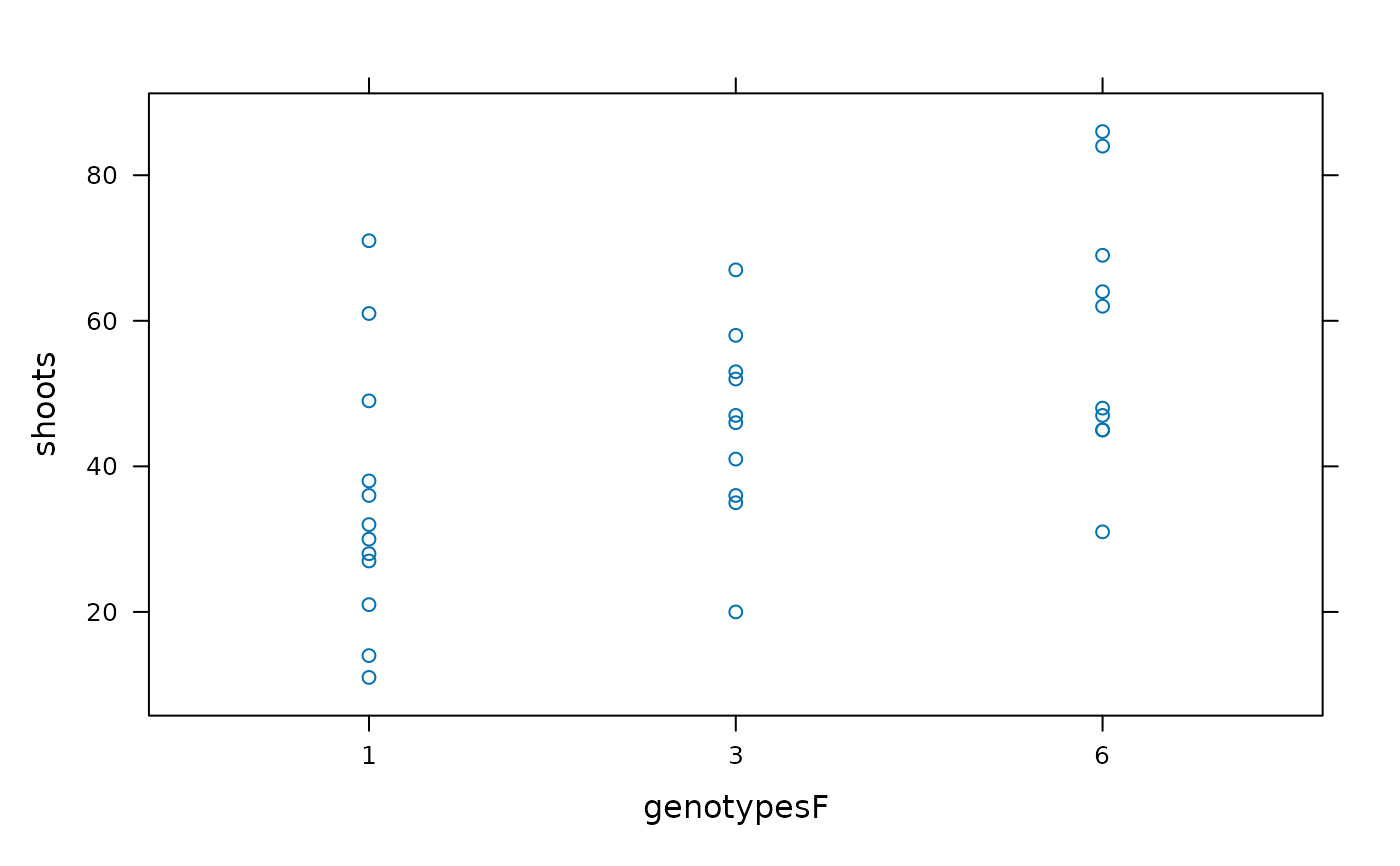
# Convert treatment.genotypes to a factor
Eelgrass$genotypesF <-
  factor(Eelgrass$genotypes)
str(Eelgrass)
#> 'data.frame':	32 obs. of  3 variables:
#>  $ genotypes : int  1 1 1 1 1 1 1 1 1 1 ...
#>  $ shoots    : int  71 61 49 38 36 32 30 28 27 21 ...
#>  $ genotypesF: Factor w/ 3 levels "1","3","6": 1 1 1 1 1 1 1 1 1 1 ...
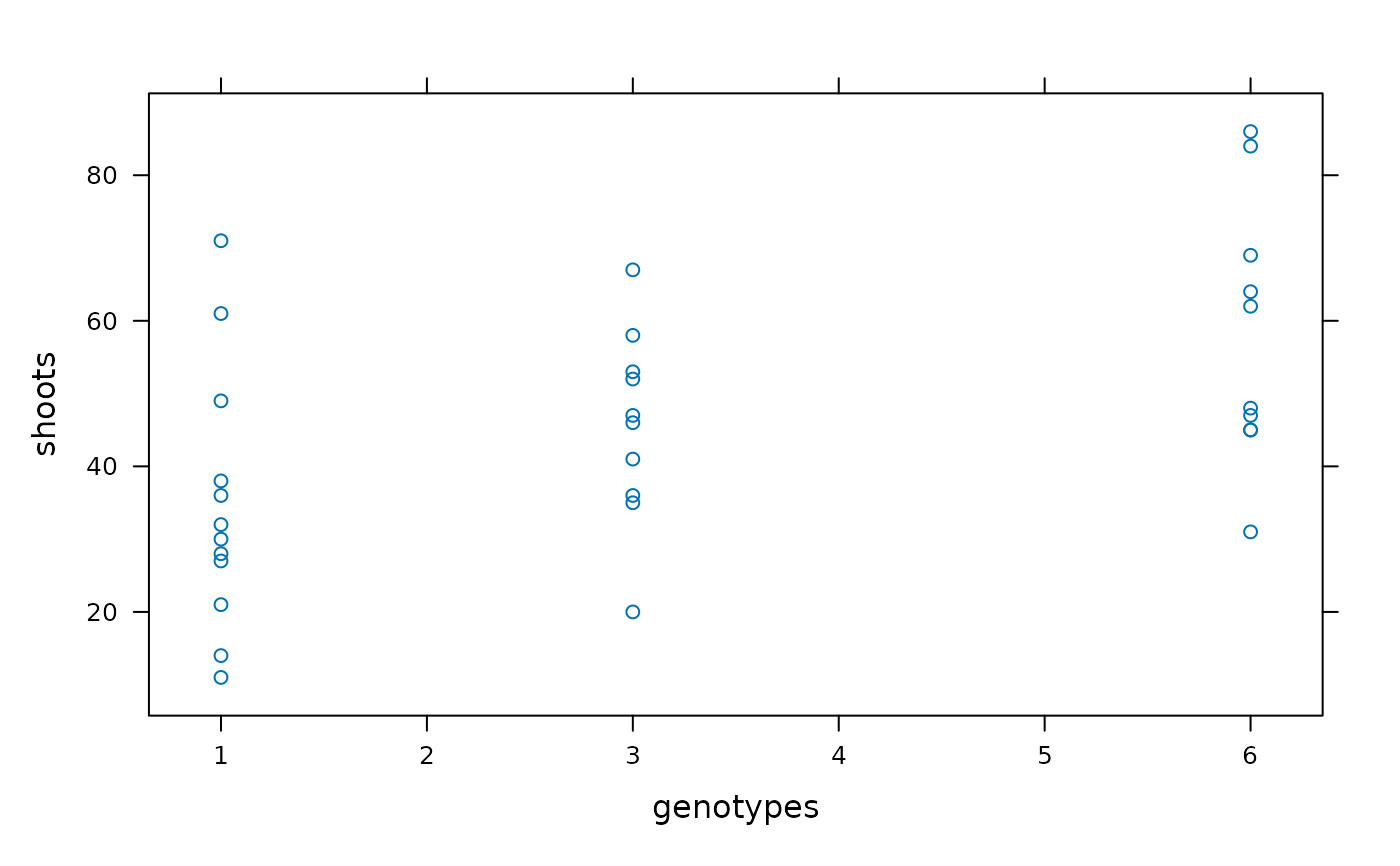
xyplot(shoots ~ genotypes, Eelgrass)

xyplot(shoots ~ genotypesF, Eelgrass)
