Grassland Diversity
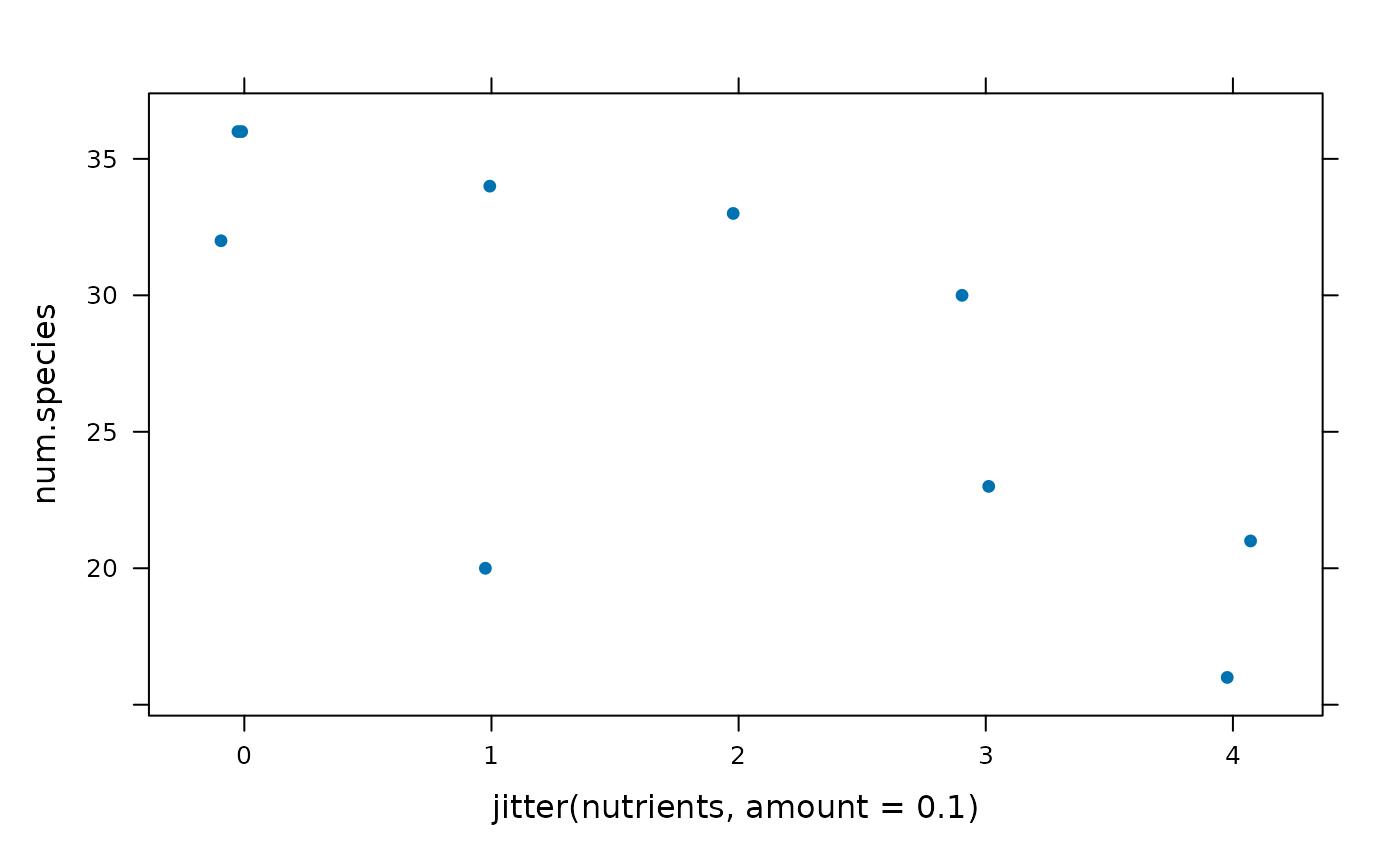
Grassland.RdSpecies diversity in 10 experimental plots in the Park Grass Experiment at Rothamsted Experimental Station to which varying numbers of nutrients have been added.
Format
A data frame with 10 observations on the following 2 variables.
- nutrients
a numeric vector
- num.species
a numeric vector
Source
Harpole, W. S. and D. Tilman. 2007. Grassland species loss due to reduced niche dimension. Nature 446: 791-793.
Examples
xyplot(num.species ~ jitter(nutrients, amount=0.1), Grassland, pch=16)
