Data for Meta-analysis
Selection.RdData for meta-analysis on the relationship between testosterone and aggression.
Format
A data frame with 814 observations on the following 8 variables.
- species
species investigated
- traitname
trait investigated
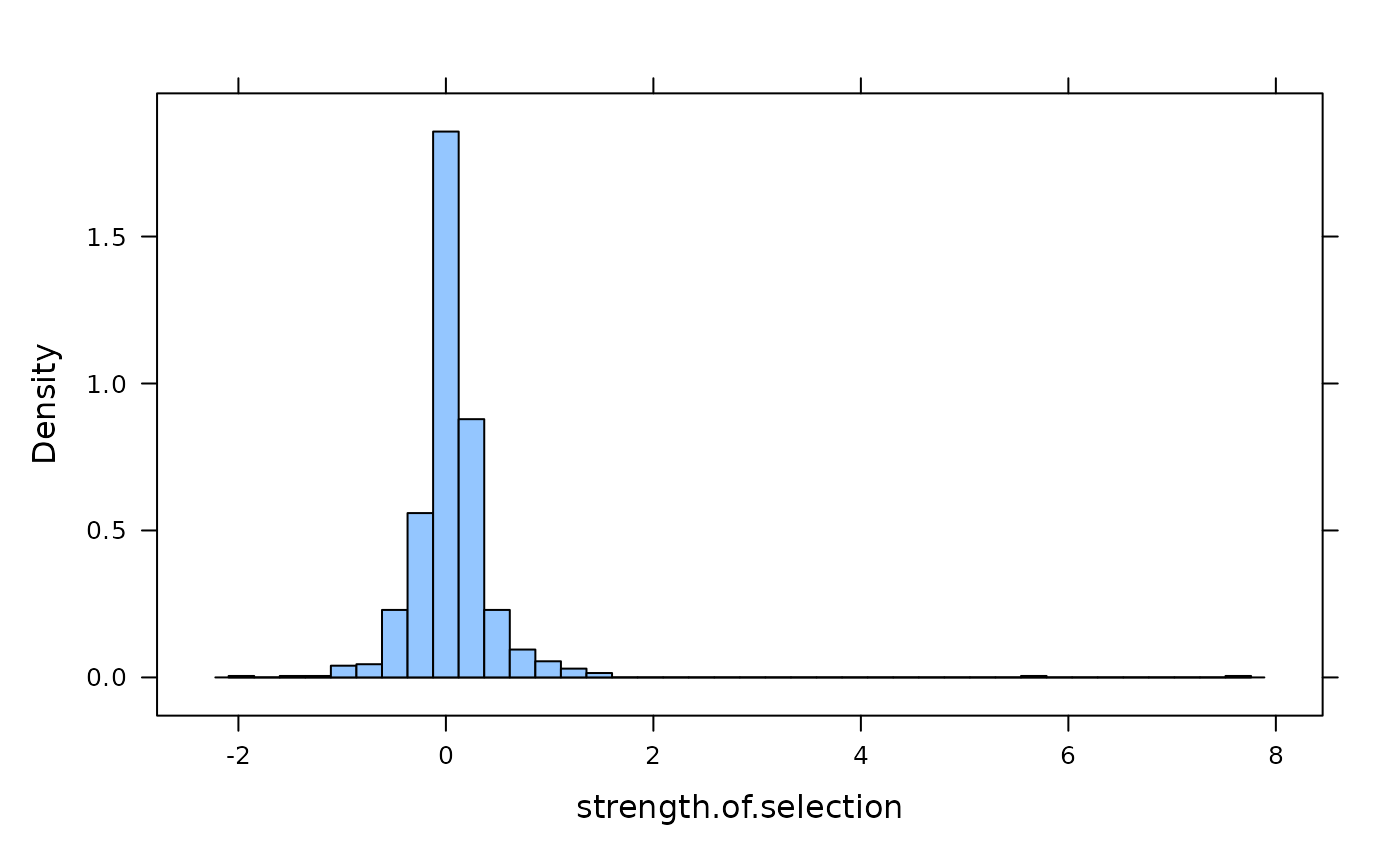
- strength.of.selection
strength of selection
- sample.size
size of sample
- authors
authors of publication
- year
year of publication
- journal
journal of publication
- volume.pages
volume and pages
Source
Kingsolver, J.G., H.E. Hoekstra, J.M. Hoekstra, D. Berrigan, S.N. Vignieri, C.E. Hill, A. Hoang, P. Gibert, and P. Beerli. 2001. The strength of phenotypic selection in natural populations. The American Naturalist 157: 245-261.
Examples
histogram(~ strength.of.selection, Selection,n=40)

table(Selection$species) -> s
table(s)
#> s
#>   1   2   3   4   5   6  11  12  17  18  19  22  23  24  25  28  30  31  38  41
#>   5   2   6   9   3   3   2   3   2   1   1   1   1   1   1   1   2   2   1   1
#>  43  59 164
#>   1   1   1
s[s>10] # most common species
#>
#>                  Aquarius remigis                 Asclepias syriaca
#>                               164                                30
#>             Bolitotherus cornutus          Chamaecrista fasciculata
#>                                17                                28
#>                   Collinsia verna                Cypripedium acaule
#>                                23                                19
#>                    Gammarus minus              Geospiza conirostris
#>                                11                                41
#>                   Geospiza fortis               Gerris odontogaster
#>                                31                                25
#>               Hetaerina americana                      Homo sapiens
#>                                17                                12
#> Ipomopsis aggregata and tenuituba                Libellula luctuosa
#>                                18                                24
#>                Lobelia cardinalis                 Melospiza melodia
#>                                11                                12
#>                  Mimulus guttatus                   Nerodia sipedon
#>                                22                                59
#>                       Parus major                  Plathhemis lydia
#>                                31                                12
#>               Pontia occidentalis               Pyrenestes ostrinus
#>                                30                                43
#>             Raphanus raphanistrum
#>                                38
table(Selection$traitname) -> t
table(t)
#> t
#>  1  2  3  4  5  6  7  8 10 11 12 13 14 15 24 28
#> 43 25 27 32  3 18  6  2  3  7  6  2  1  4  1  1
t[t>10] # most common traits
#>
#>     abdomen length (multivariate)       abdomen length (univariate)
#>                                11                                11
#>                        beak depth                       beak length
#>                                13                                13
#>                         body size                DB (dors blotches)
#>                                12                                15
#>     genital length (multivariate)       genital length (univariate)
#>                                11                                11
#>                habitat preference                 LB (lat blotches)
#>                                28                                15
#> mesofemoral length (multivariate)   mesofemoral length (univariate)
#>                                12                                12
#>   profemoral width (multivariate)     profemoral width (univariate)
#>                                12                                12
#>              ROWS (ht of lat blot      thorax length (multivariate)
#>                                15                                11
#>        thorax length (univariate)             timing of germination
#>                                11                                24
#>    total body length (univariate)             VEXT extent of venter
#>                                11                                15
#>                            weight                       wing length
#>                                12                                14