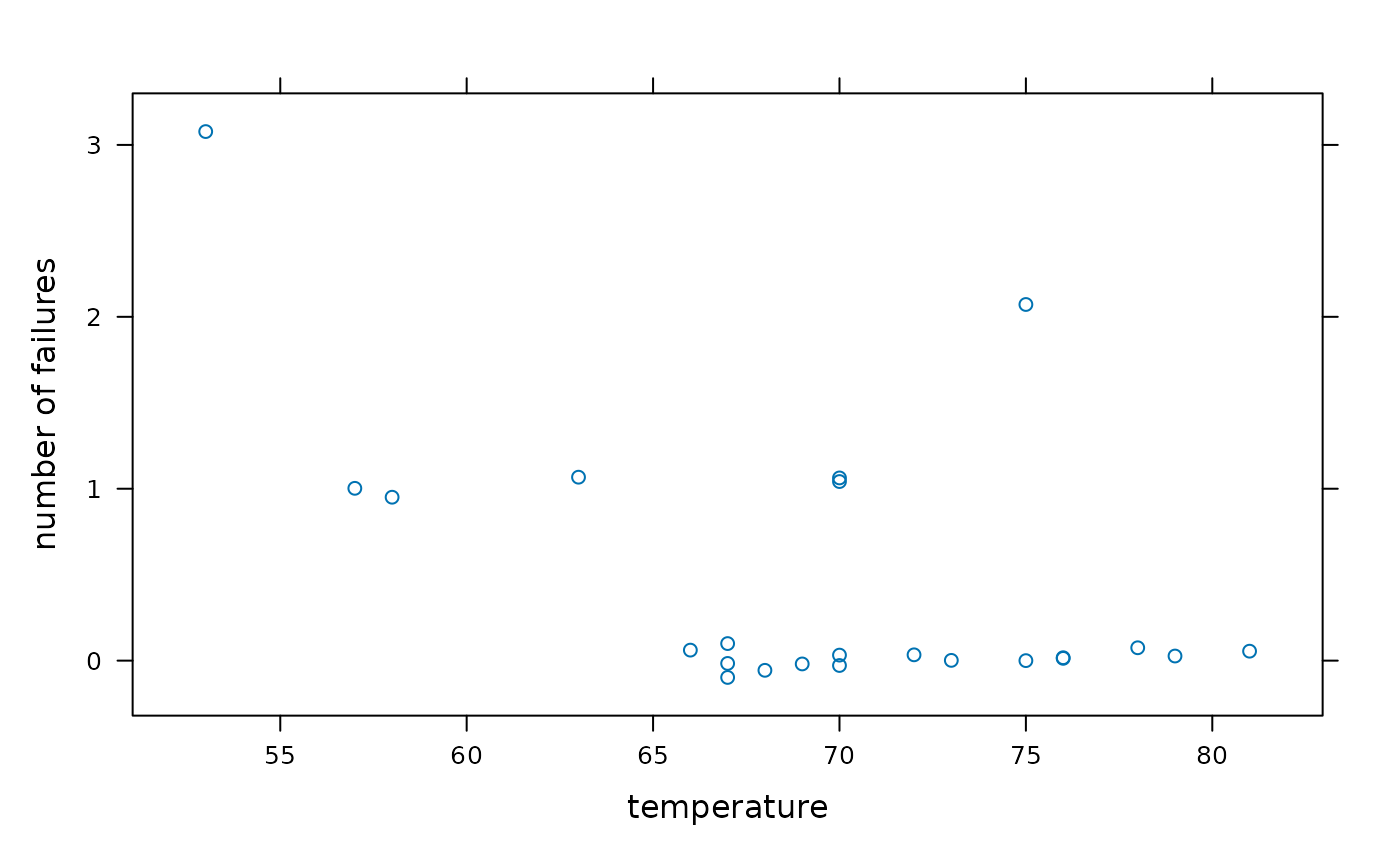
Ambient Temperature and O-Ring Failures
ShuttleDisaster.RdData on temperature and number of O-ring failures for 23 space
shuttle launches.
Format
A data frame with 23 observations on the following 2 variables.
- temperature
a numeric vector
- failures
a numeric vector
Source
Dalal, S.R., E.B. Fowlkes, and B. Hoadley. 1989. Risk analysis of the Space Shuttle: Pre-Challenger prediction of failure. Journal of the American Statistical Association 408: 945-957.
