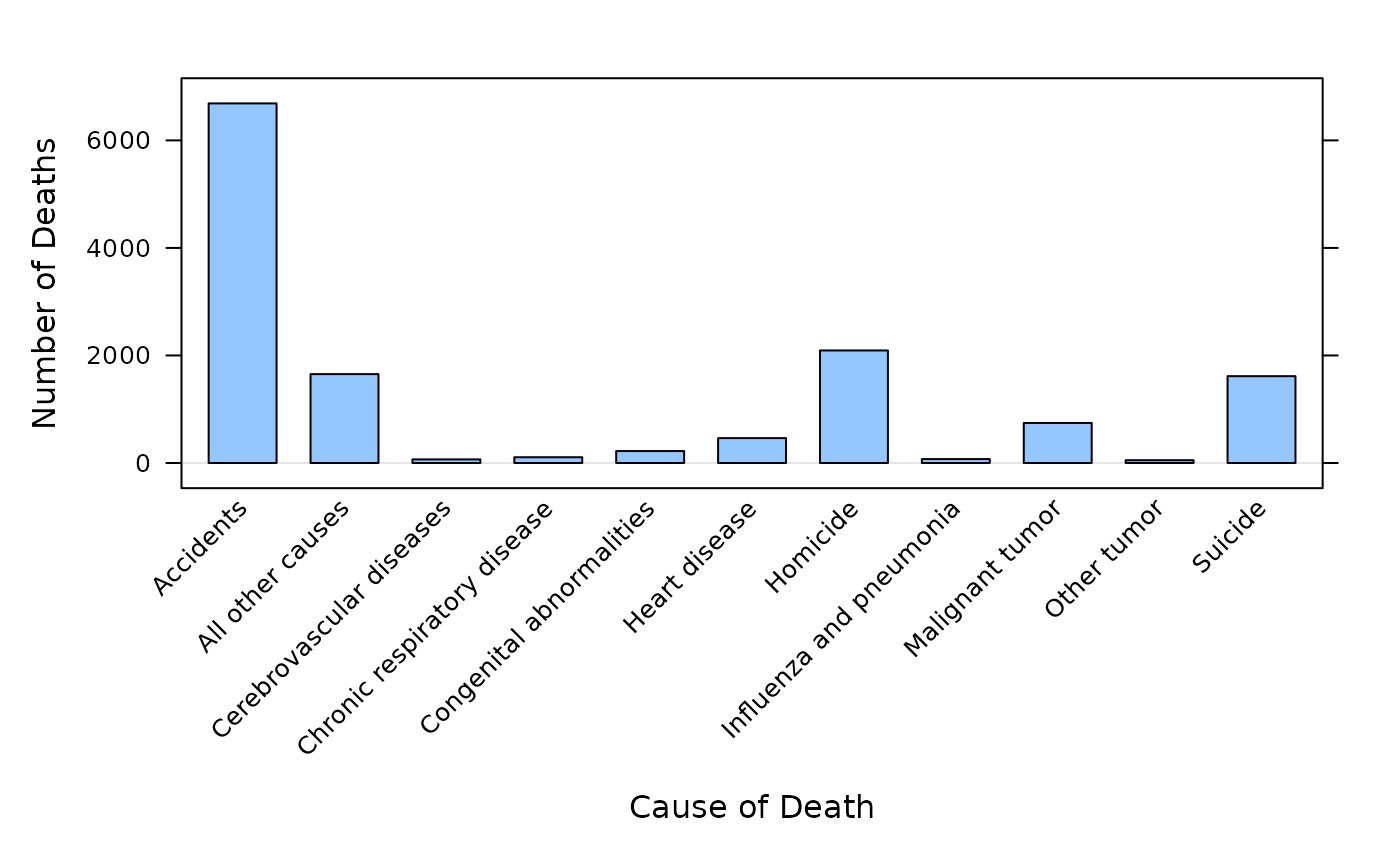
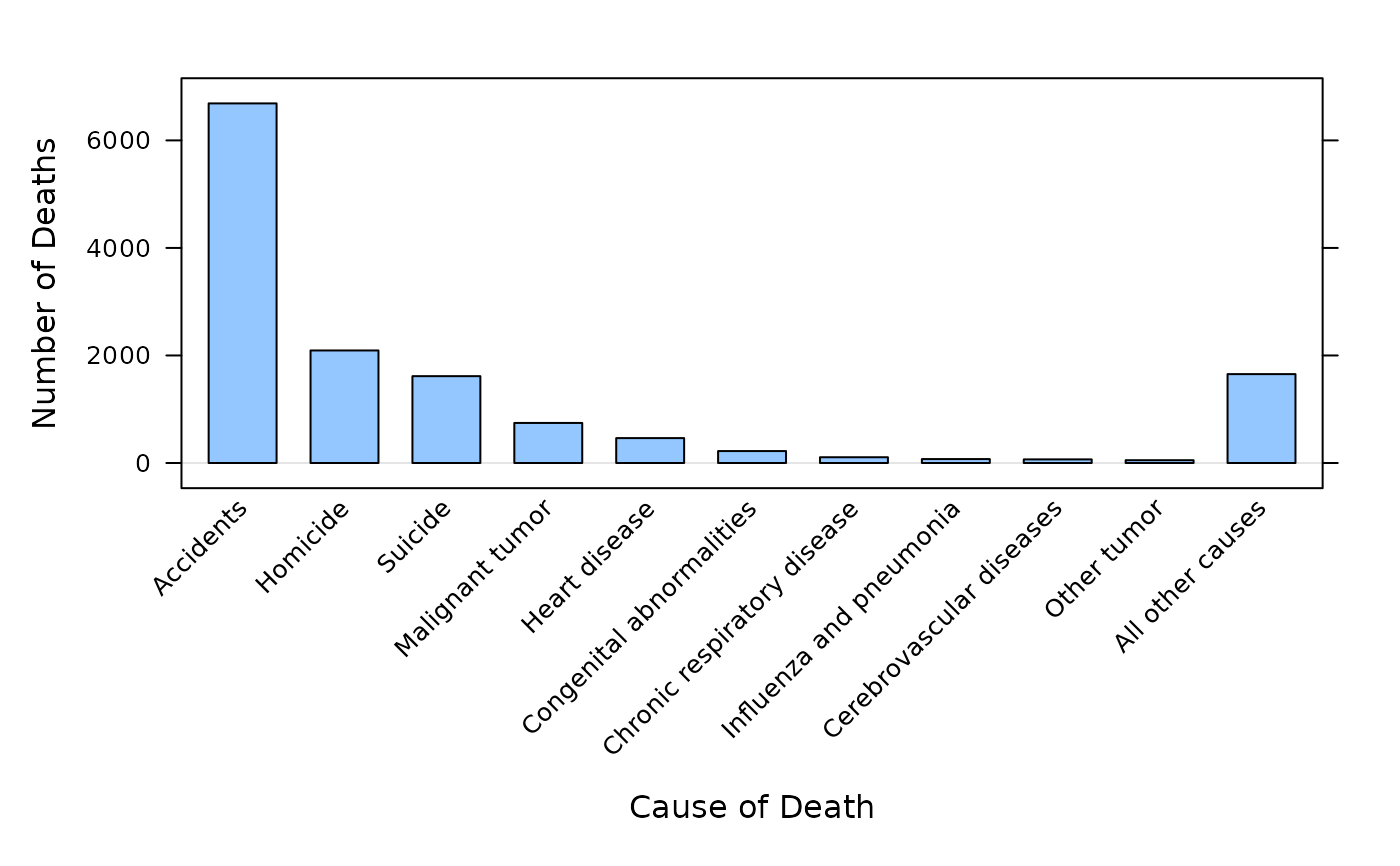
Causes of Teenage Deaths
TeenDeaths.RdData from Table 1 (p. 14) on causes of death for all races, both sexes, ages 15-19.
Format
A data frame with 11 observations on the following 2 variables.
- cause
a character vector
- deaths
a numeric vector
Source
Anderson, R.N. 2001. Deaths: Leading causes for 1999. National vital statistics reports 49(11):1-88. National Center for Health Statistics; Hyattsville, Maryland.
Examples
str(TeenDeaths)
#> 'data.frame':	11 obs. of  2 variables:
#>  $ cause : Factor w/ 11 levels "Accidents","All other causes",..: 1 7 11 9 6 5 4 8 3 10 ...
#>  $ deaths: int  6688 2093 1615 745 463 222 107 73 67 52 ...
TeenDeaths
#>                          cause deaths
#> 1                    Accidents   6688
#> 2                     Homicide   2093
#> 3                      Suicide   1615
#> 4              Malignant tumor    745
#> 5                Heart disease    463
#> 6     Congenital abnormalities    222
#> 7  Chronic respiratory disease    107
#> 8      Influenza and pneumonia     73
#> 9     Cerebrovascular diseases     67
#> 10                 Other tumor     52
#> 11            All other causes   1653

barchart(deaths ~ cause, TeenDeaths,
  horizontal = FALSE,
  ylab = "Number of Deaths",
  xlab = "Cause of Death", origin=0,
  scales = list(x = list(rot=45)))


barchart(deaths~ordered(cause, levels=cause), TeenDeaths,
  horizontal = FALSE,
  ylab = "Number of Deaths",
  xlab = "Cause of Death", origin=0,
  scales=list(x=list(rot=45))
  )
