Right-handed Toads
Toads.RdHypothetical probability of a toad being right-handed
Format
A data frame with 19 observations on the following 2 variables.
- n.toads
a numeric vector
- prob
a numeric vector
Examples
Toads
#>    n.toads     prob
#> 1        0 0.000004
#> 2        1 0.000070
#> 3        2 0.000600
#> 4        3 0.003100
#> 5        4 0.011700
#> 6        5 0.032700
#> 7        6 0.070800
#> 8        7 0.121400
#> 9        8 0.166900
#> 10       9 0.185500
#> 11      10 0.166900
#> 12      11 0.121400
#> 13      12 0.070800
#> 14      13 0.032700
#> 15      14 0.011700
#> 16      15 0.003100
#> 17      16 0.000600
#> 18      17 0.000070
#> 19      18 0.000004
# generate this data manually
cbind(0:18, dbinom(0:18, 18, 0.5))
#>       [,1]         [,2]
#>  [1,]    0 3.814697e-06
#>  [2,]    1 6.866455e-05
#>  [3,]    2 5.836487e-04
#>  [4,]    3 3.112793e-03
#>  [5,]    4 1.167297e-02
#>  [6,]    5 3.268433e-02
#>  [7,]    6 7.081604e-02
#>  [8,]    7 1.213989e-01
#>  [9,]    8 1.669235e-01
#> [10,]    9 1.854706e-01
#> [11,]   10 1.669235e-01
#> [12,]   11 1.213989e-01
#> [13,]   12 7.081604e-02
#> [14,]   13 3.268433e-02
#> [15,]   14 1.167297e-02
#> [16,]   15 3.112793e-03
#> [17,]   16 5.836487e-04
#> [18,]   17 6.866455e-05
#> [19,]   18 3.814697e-06
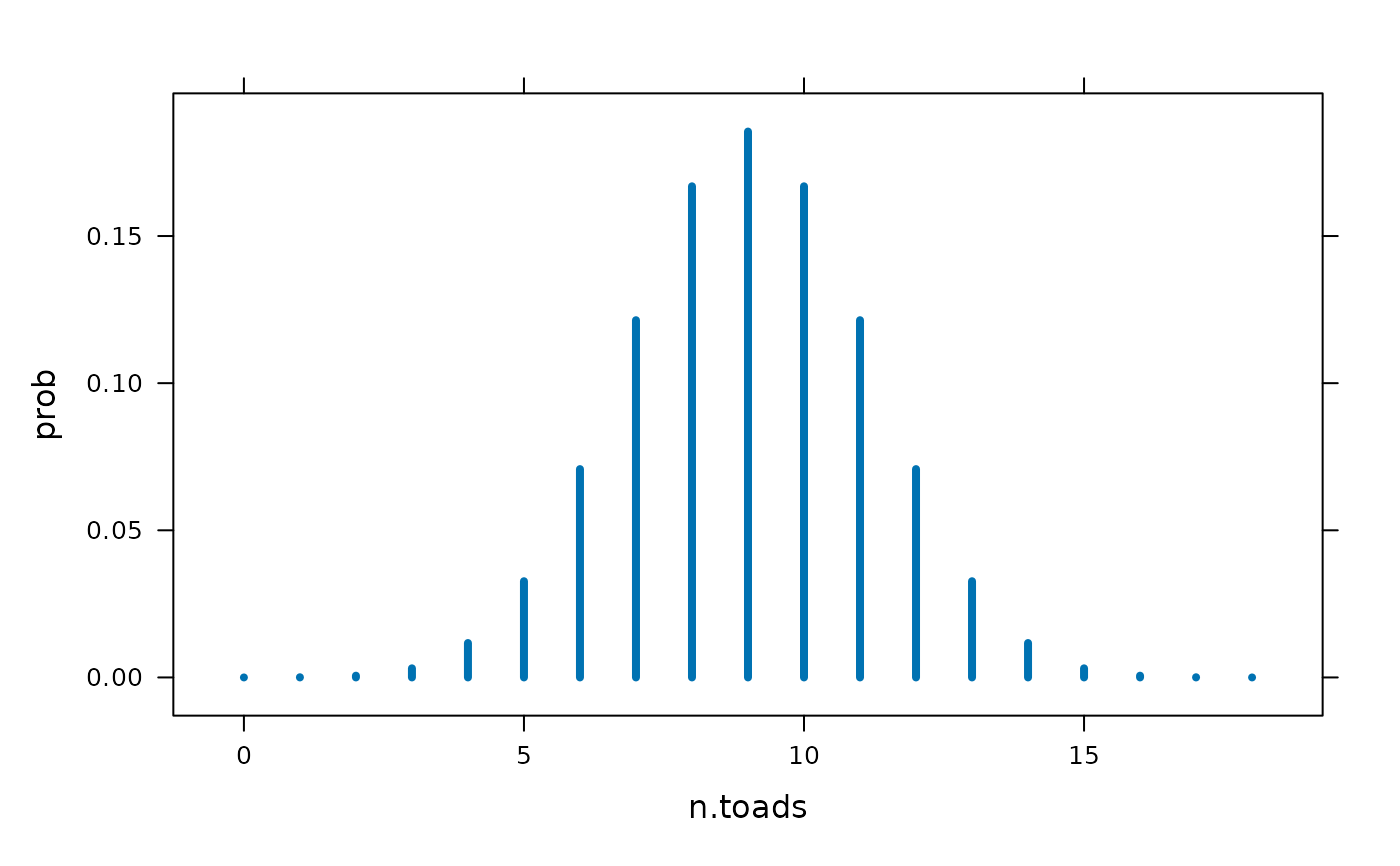
xyplot(prob ~ n.toads, Toads, type = 'h', lwd = 4)

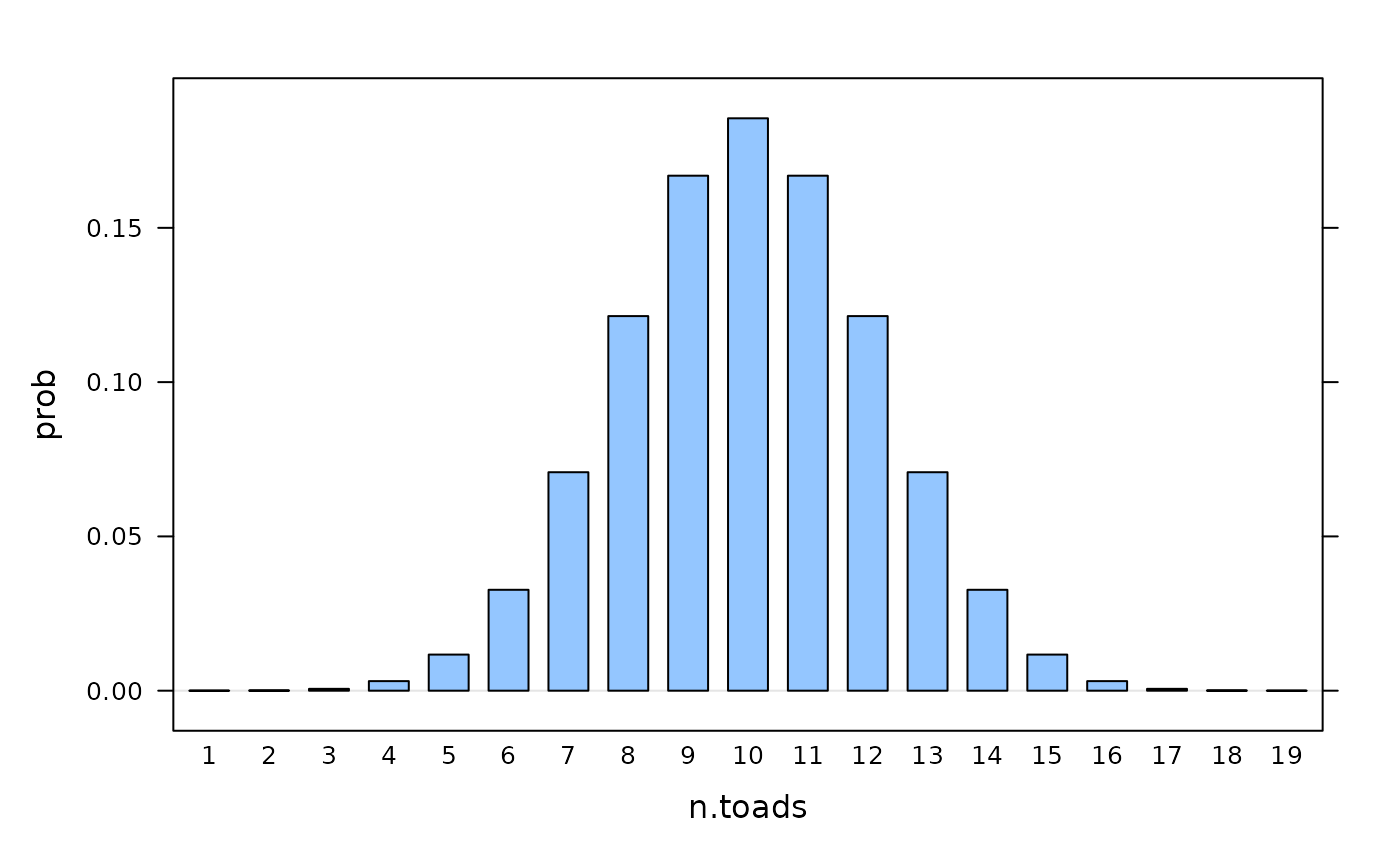
barchart(prob ~ n.toads, Toads, origin=0, horizontal=FALSE)

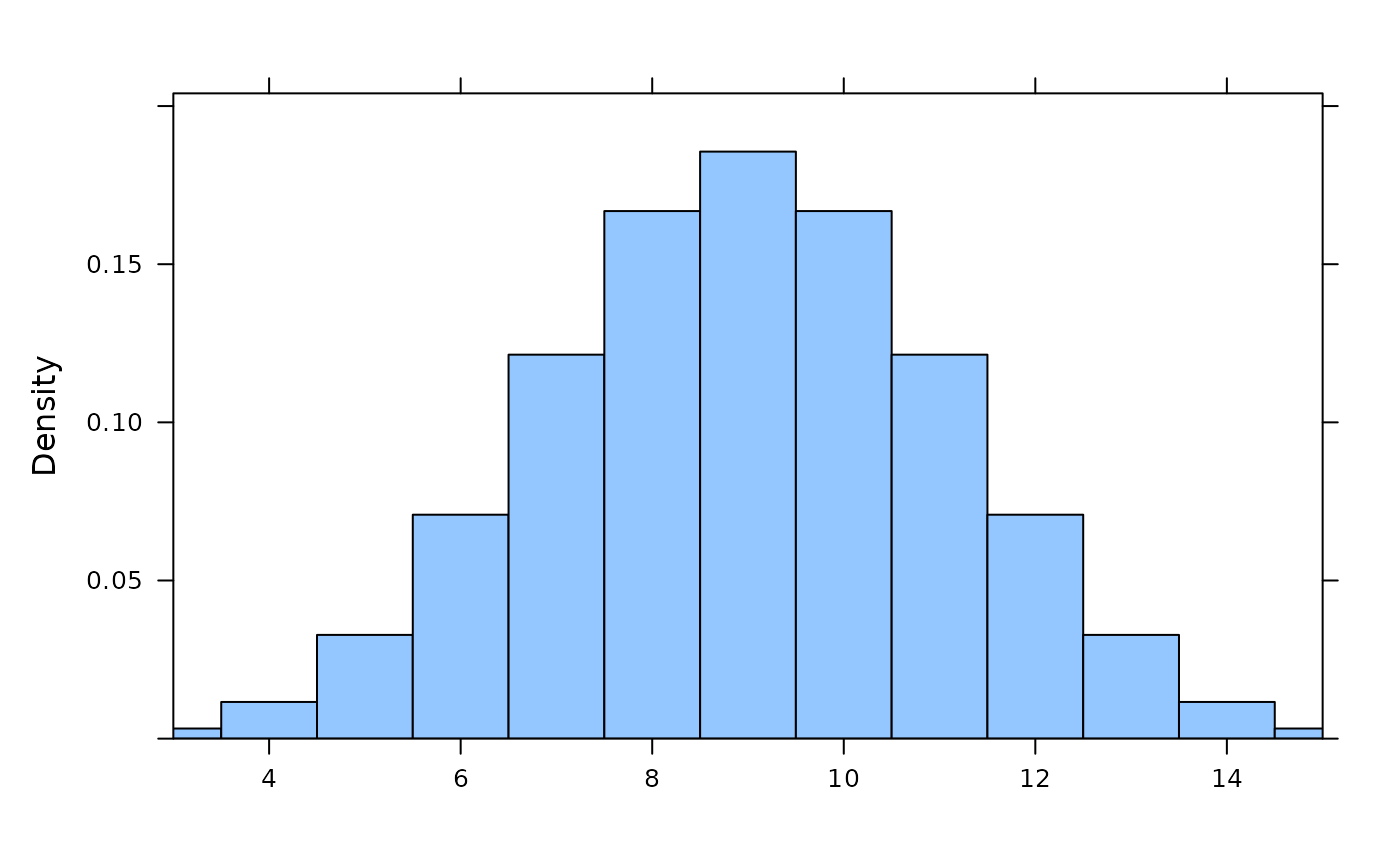
plotDist('binom', params = list(18,0.5), kind = 'hist')
