Plot jnt Object
# S3 method for jnt
plot(x, reg_lty = 1, jnt_lty = 2, col_signif = "red", plot_range = TRUE, ...)
Arguments
| x | Object of class |
|---|---|
| reg_lty | Line type for regression lines. Defaults to 1. |
| jnt_lty | Line type for range of insignificant differences. Defaults to 2. |
| col_signif | Color for bars denoting range of insignificance. Defaults to "red." |
| plot_range | logical. If |
| ... | Additional parameters passed to ggplot (e.g., lwd, pch, xlab, ylab). |
Details
Plot object returned by jnt.
Author
Kevin Middleton middletonk@missouri.edu
Examples
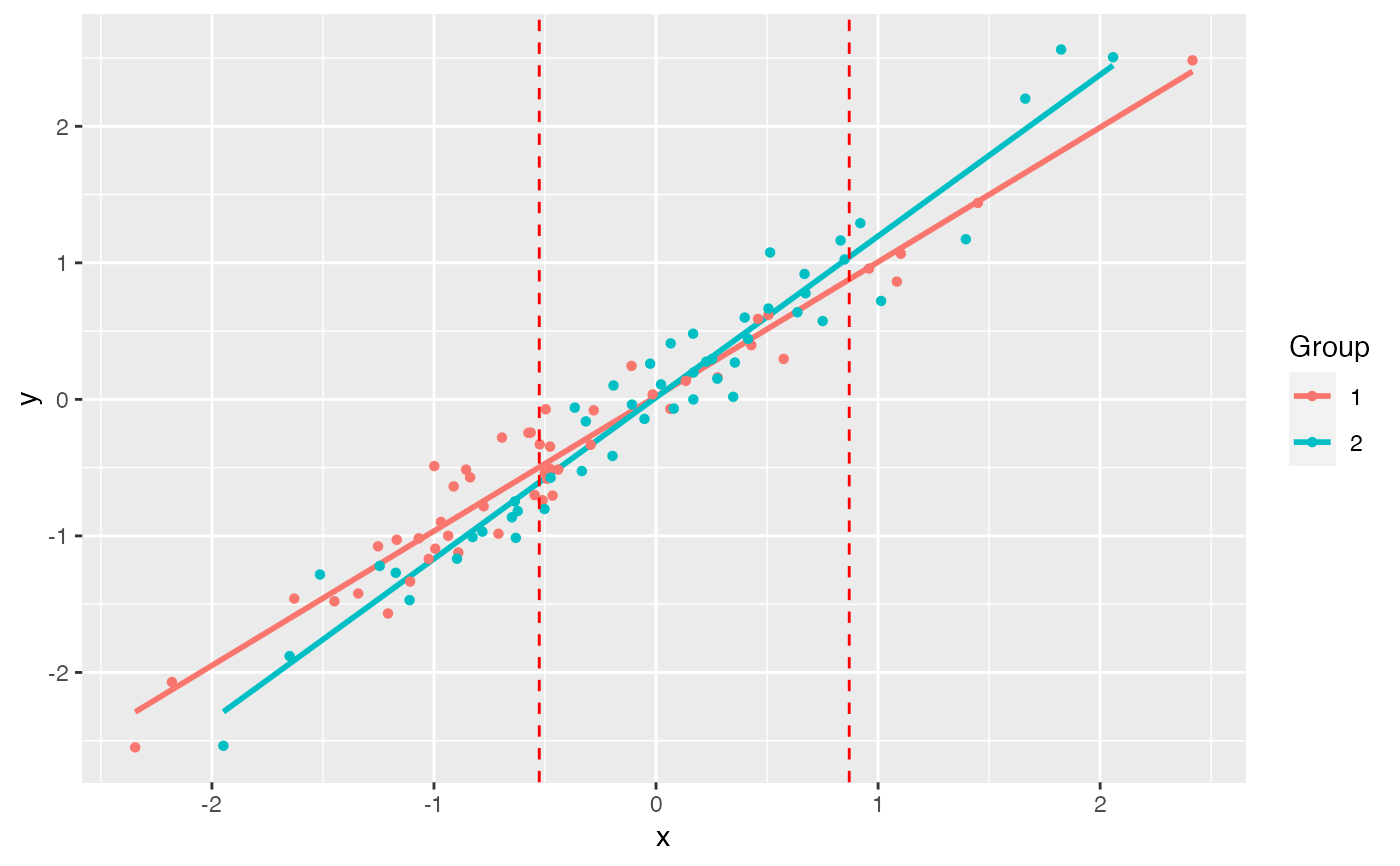
example(jnt)
#>
#> jnt> # Simulate data
#> jnt> set.seed(1234)
#>
#> jnt> n <- 50
#>
#> jnt> x1 <- rnorm(n)
#>
#> jnt> y1 <- x1 + rnorm(n, sd = 0.2)
#>
#> jnt> x2 <- rnorm(n)
#>
#> jnt> y2 <- 1.25 * x2 + rnorm(n, sd = 0.2)
#>
#> jnt> df1 <- data.frame(x = x1, y = y1)
#>
#> jnt> df2 <- data.frame(x = x2, y = y2)
#>
#> jnt> (jnt.out <- jnt(df1, df2))
#> Fitting with OLS
#> Assuming x variable is column 1, and y is column 2.
#>
#> Johnson-Neyman Technique
#>
#> Alpha =  0.05
#>
#> Data 1:
#> 	Slope		 0.9853
#> 	Intercept	 0.02126
#>
#> Data 2:
#> 	Slope		 1.182
#> 	Intercept	 0.01386
#>
#> Region of non-significant slope difference
#> 	Lower: -0.5258
#> 	Upper: 0.8701
#>
#>
#> jnt> plot(jnt.out)
#> `geom_smooth()` using formula 'y ~ x'