Data set 1 from Lavin et al., 2008
Format
A data frame with 64 observations on the following 2 variables.
V1a numeric vector
V2a numeric vector
References
Lavin SR, Karasov WH, Ives AR, Middleton KM, Garland T, Jr (2008) Morphometrics of the avian small intestine compared with that of nonflying mammals: A phylogenetic approach. Physiol Biochem Zool 81: 526-550.
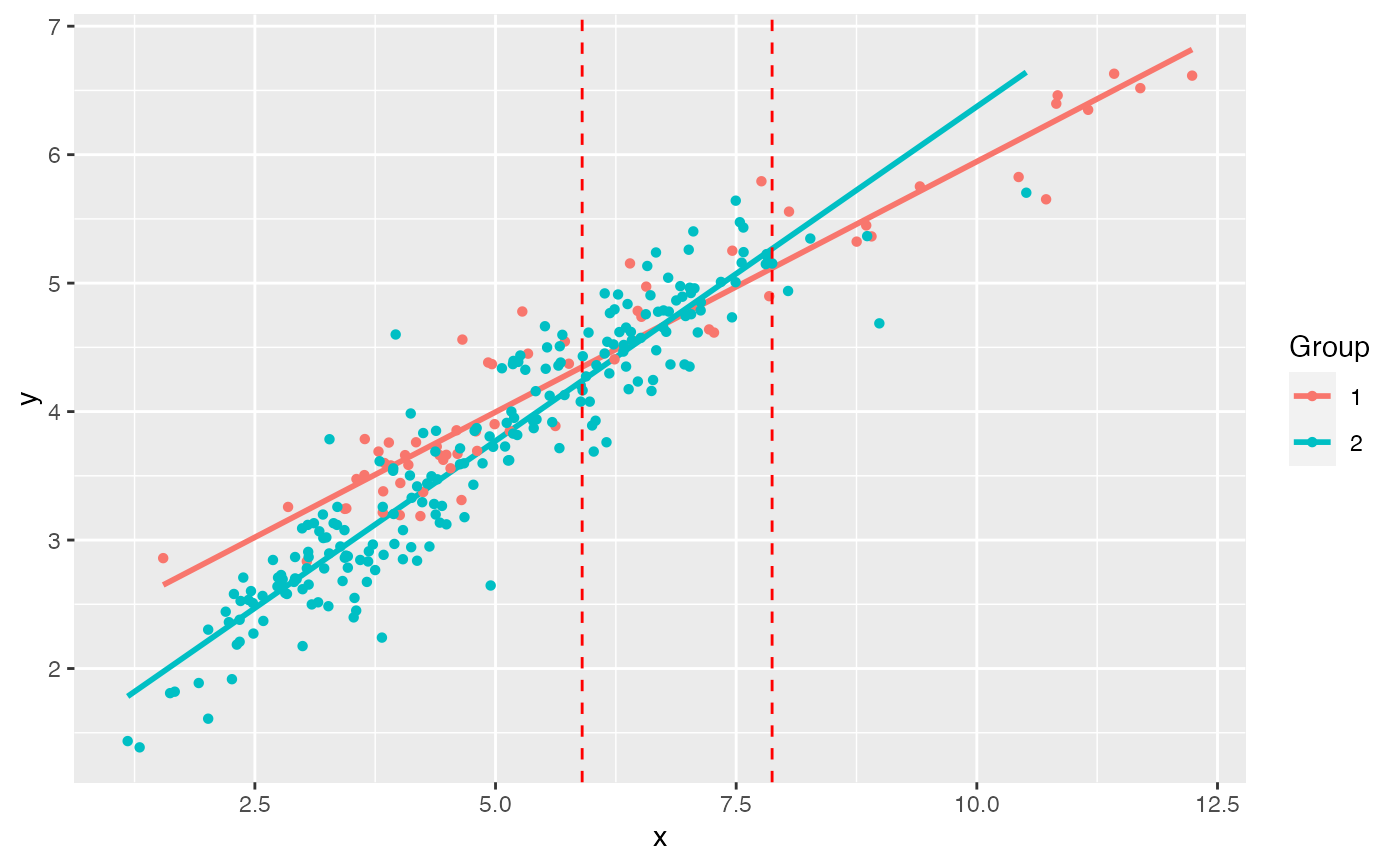
Examples
str(Lavin.1)
#> 'data.frame':	64 obs. of  2 variables:
#>  $ V1: num  3.04 1.55 4.01 4.22 3.83 ...
#>  $ V2: num  2.83 2.86 3.19 3.19 3.21 ...
str(Lavin.2)
#> 'data.frame':	220 obs. of  2 variables:
#>  $ V1: num  1.3 1.18 2.01 1.62 1.67 ...
#>  $ V2: num  1.39 1.44 1.61 1.81 1.82 ...

(Lavin <- jnt(Lavin.1, Lavin.2))
#> Fitting with OLS
#> Assuming x variable is column 1, and y is column 2.
#>
#> Johnson-Neyman Technique
#>
#> Alpha =  0.05
#>
#> Data 1:
#> 	Slope		 0.39
#> 	Intercept	 2.047
#>
#> Data 2:
#> 	Slope		 0.5205
#> 	Intercept	 1.169
#>
#> Region of non-significant slope difference
#> 	Lower: 5.9
#> 	Upper: 7.873
#>
plot(Lavin)
#> `geom_smooth()` using formula 'y ~ x'